In this blog, we will talk about the basic concepts of logistics regression and what kind of problems it can help us solve.
Logistic Regression is a ranking algorithm used to assign observations to a separate set of classes. Some examples of classification issues are email spam or not spam, online transactions not fraud or deception, tumors malignant or benign. Logistics regression changes its output using the logistic sigmoid function to return the potential value.
1 - Binary Logistic Regression: Involves two categories or classes, such as determining if a tumor is malignant or benign.
2 - Multinomial Logistic Regression: Used when there are more than two classes, for example, classifying images as boat, car, or airplane.
Logistic regression is a machine learning algorithm used for classification problems, it is a predictive analysis algorithm and is based on the concept of probability.
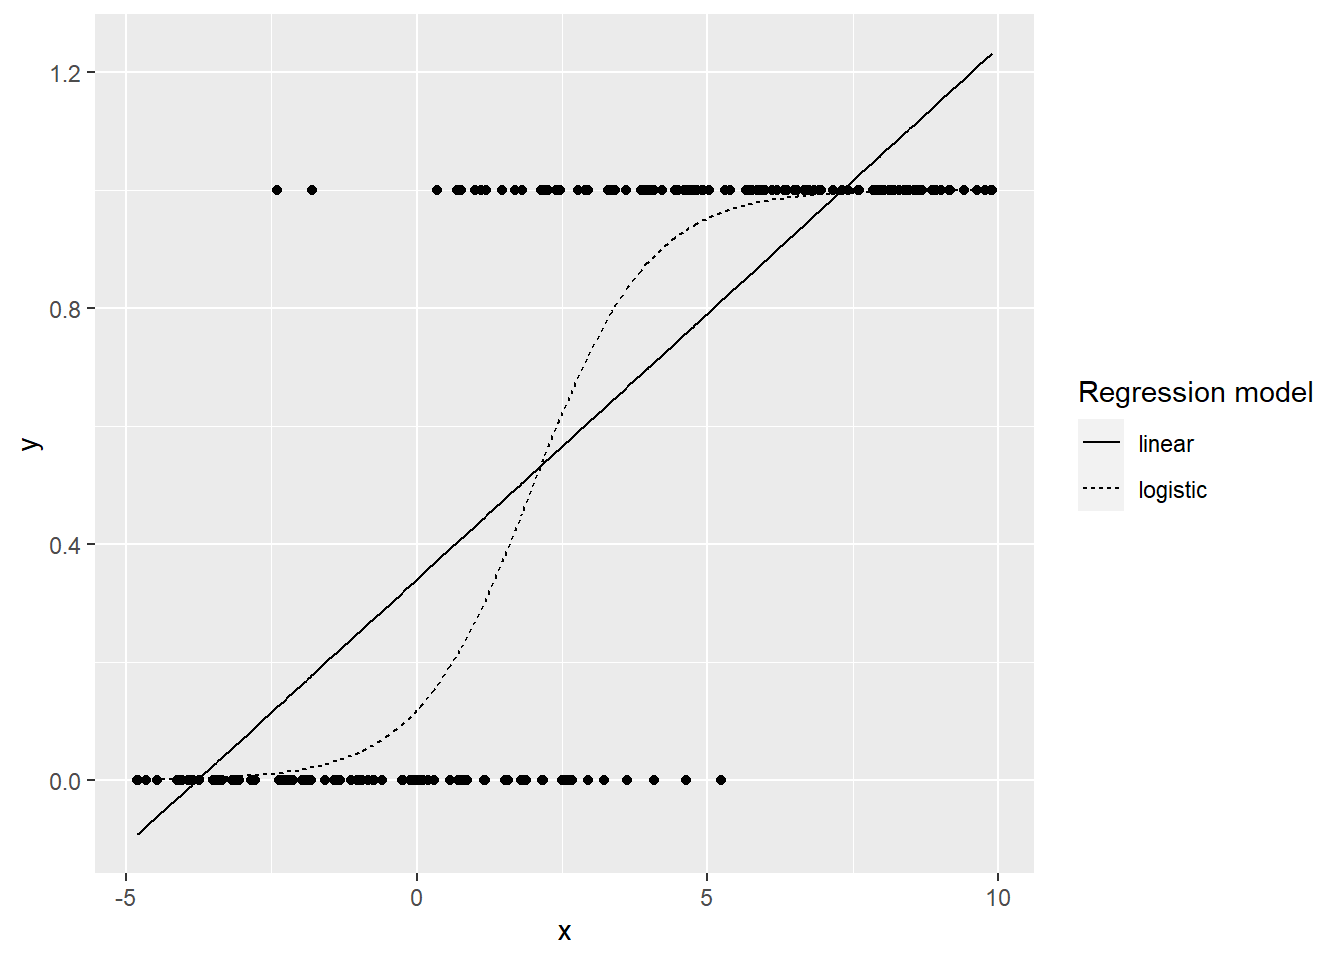
We can call logistics regression a linear regression model but logistic regression uses a more complex cost function, this cost function can also be known as 'logistic function' instead of 'sigmoid function' or linear function.
The logistic regression hypothesis limits it to a cost function between 0 and 1 so linear functions fail to represent it because its value can be greater than 1 or less than 0 which is not possible according to the logistic regression hypothesis Is.

To map the probabilities to the predicted values, we use the sigmoid function. The function maps any real value between 0 and 1 to another value. In machine learning, we use sigmoid to map predictions.

Sigmoid Function Graph

Formula of a sigmoid function
When using linear regression we used a formula of the hypothesis i.e.
hΘ(x) = β₀ + β₁X
For logistic regression we are going to modify it a little bit i.e.
σ(Z) = σ(β₀ + β₁X)
We have expected that our hypothesis will give values between 0 and 1.
Z = β₀ + β₁X
hΘ(x) = sigmoid(Z)
i.e. hΘ(x) = 1/(1 + e^-(β₀ + β₁X)

The Hypothesis of logistic regression
We expect our classifiers to give us a set of outputs or classes as we pass the input through the prediction function and return a potential score between 0 and 1.
For example, we have 2 classes, let's treat them like cats and dogs (1-dog, 0-cats). We basically decide with the price of a threshold above which we classify the values in class 1 and the price goes below the threshold then we classify it in class 2.
We learnt about the cost function J(θ) in the Linear regression, the cost function represents optimization objective i.e. we create a cost function and minimize it so that we can develop an accurate model with minimum error.

The Cost function of Linear regression
If we try to use the cost function of the linear regression in ‘Logistic Regression’ then it would be of no use as it would end up being a non-convex function with many local minimums, in which it would be very difficult to minimize the cost value and find the global minimum.
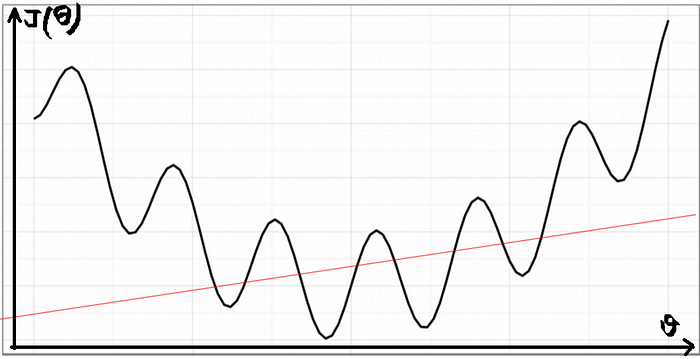
Non-convex function
For logistic regression, the Cost function is defined as:
−log(hθ(x)) if y = 1
−log(1−hθ(x)) if y = 0

Cost function of Logistic Regression
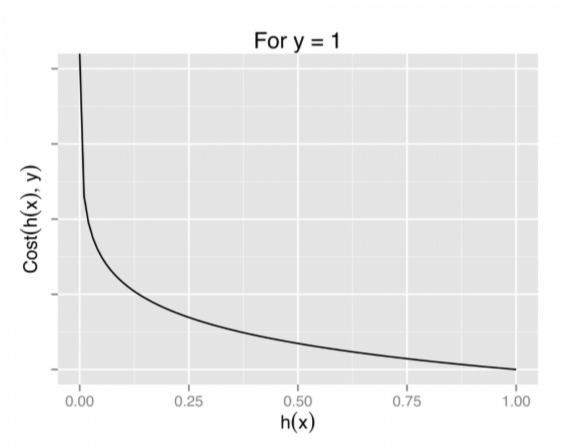
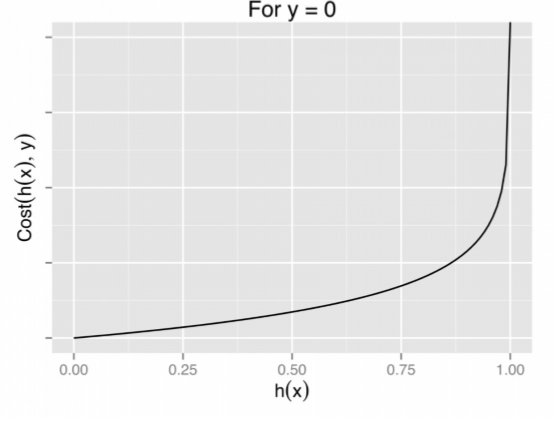
Graph of logistic regression
The above two functions can be compressed into a single function i.e.

Above functions compressed into one cost function
Now the question arises how do we reduce the cost price? Well, this can be done using gradient decent. The main purpose of the gradient descent is to reduce the cost. That is, Min J (θ).
Now, to reduce our cost function, we need to run the slope down function on each parameter.

Objective: To minimize the cost function we have to run the gradient descent function on each parameter
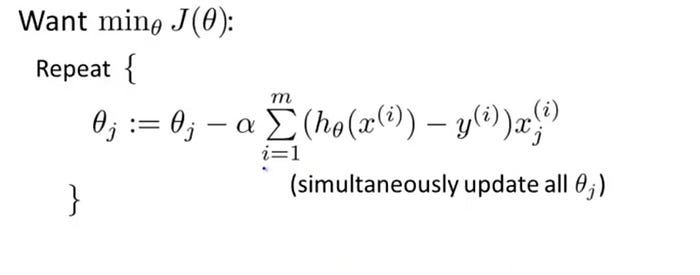
Gradient Descent Simplified | Image: Andrew Ng Course
Gradient descent has an analogy in which we have to imagine ourselves at the top of a mountain valley and left stranded and blindfolded, our objective is to reach the bottom of the hill. Feeling the slope of the terrain around you is what everyone would do. Well, this action is analogous to calculating the gradient descent, and taking a step is analogous to one iteration of the update to the parameters.
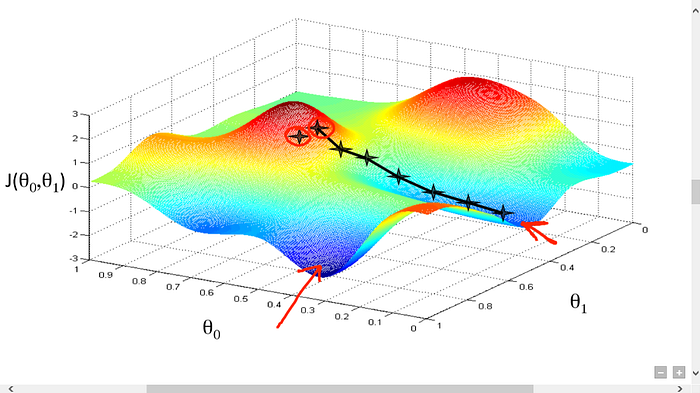
Gradient Descent analogy